Data Insights: Table Analysis Sample Questions
3 of 3
Calculator
Sort By:
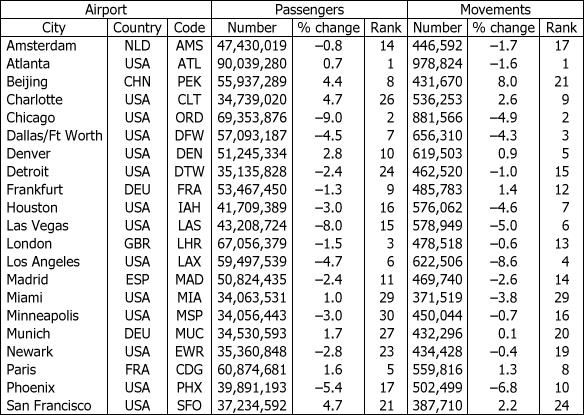
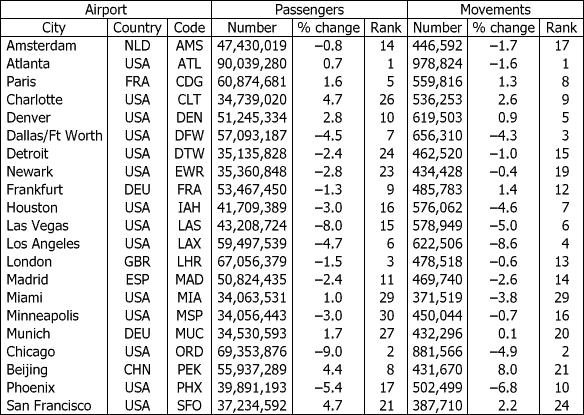
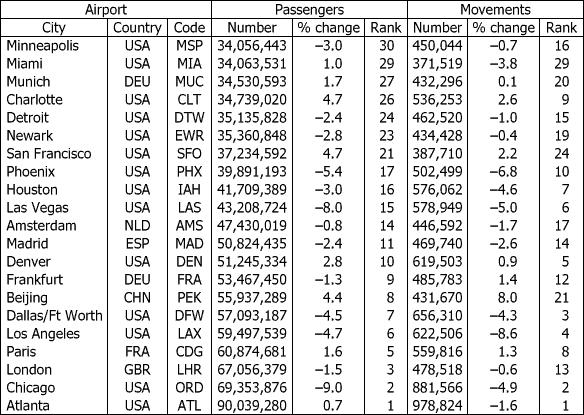
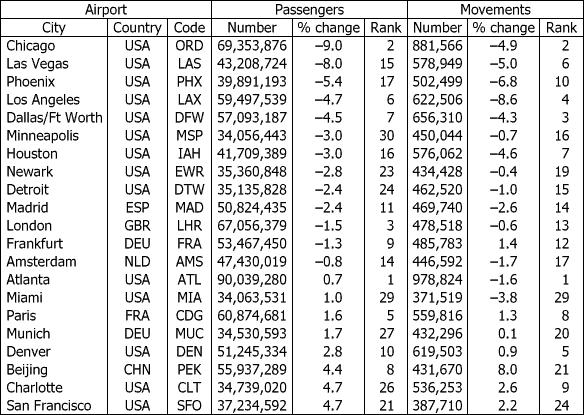
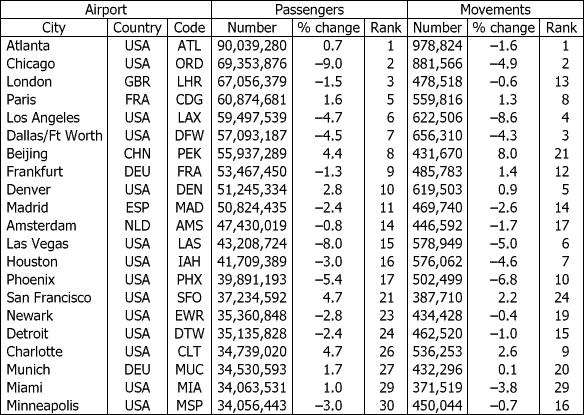
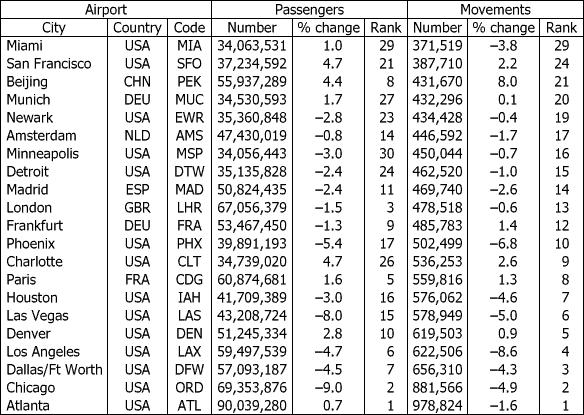
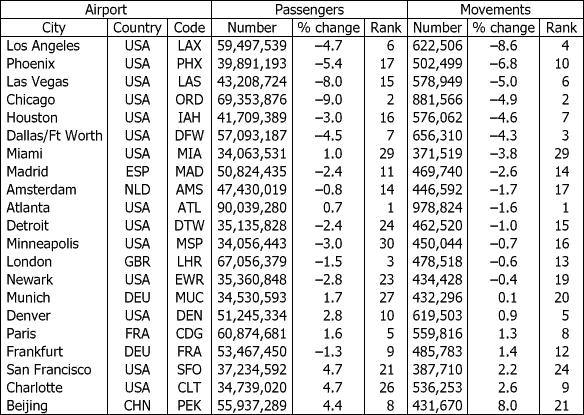
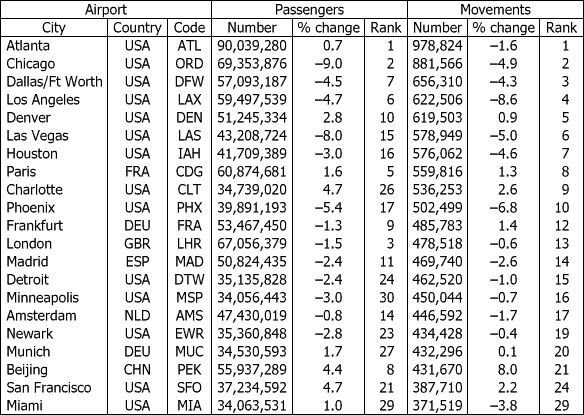
The table above gives information for 2008 on total passengers (total passengers enplaned and deplaned with passengers in transit counted once) and total movements (landing and takeoff of an aircraft) for 21 airports throughout the world. The 21 airports were chosen for inclusion in the table because, in 2008, each was among the busiest 30 airports in the world in terms of both total passengers and total movements. In addition to the numbers of total passengers and total movements for each airport, the table also gives the percent of increase and decrease over the numbers for 2007 and the rank of the airport for total passengers and total movements.
Each column of the table can be sorted in ascending order by clicking on the word “Select” above the table and choosing, from the drop-down menu, the heading of the column on which you want the table to be sorted.
Consider each of the following statements about these airports. For each statement indicate whether the statement is true or false, based on the information provided in the table.
True
False
The airport experiencing the greatest percent decrease in total passengers from 2007 to 2008 also experienced the greatest decrease in the percent of movements.
The airport with the median rank based on total number of passengers is the same as the airport with the median rank based on total number of movements.
Exactly 50% of the airports that experienced an increase in both total number of passengers and in total number of movements are located in the United States (USA).
Within the GMAT Focus Edition Exam, users will have access to a standard scientific calculator.
* Please note that the calculator shown here is not functional, but merely for demonstration purposes.
Within the GMAT Focus Edition Exam, users experiencing technical issues can seek help at any time.